Javier Elío
Javier Elío
Personal Info
Posts
Projects
Publications
Recent & Upcoming Talks
CV
Light
Dark
Automatic
Posts
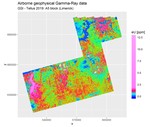
Day 5 of the #30DayMapChallenge - Raster
I plotted airborne radiometric data from the Tellus survey (Geological Survey, Ireland). Load packages: library(sf) library(tidyverse) Download the radiomatric data (Tellus 2019: A5 block (Limerick)): dir.create("Rdata") Radiometric_URL <- "https://secure.
Last updated on Jun 29, 2020
1 min read
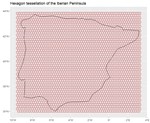
Day 4 of the #30DayMapChallenge - Hexagons
I made a hexagon tessellation of a region (e.g.Iberian Peninsula): Download country data from Eurostat. World_URL <- "https://ec.europa.eu/eurostat/cache/GISCO/distribution/v2/countries/download/ref-countries-2016-60m.shp.zip" dir.create("Rdata") download.file(World_URL, destfile = "Rdata/World.zip") unzip(zipfile = "Rdata/World.zip", exdir = "Rdata/World") unzip(zipfile = "Rdata/World/CNTR_RG_60M_2016_4326.
Last updated on Apr 3, 2021
1 min read
Day 3 of the #30DayMapChallenge - Polygons
I plotted a wold map (scale 1:60 Million) with color varying by country. Download the data from Eurostat, where there are geographic data of: Administrative units – statistical units
Last updated on Jun 29, 2020
1 min read
«
Cite
×