Get free data from Statistic Denmark
Get data to play with is a key part for learning R and therefore any source of public data is more than welcome. In this regard, I recently come across the danstat package. It gives access to all the data that are published on Statistics Denmark. I think it is an excellent opportunity for using real data and I have therefore tested it. The vignette is really informative. It introduces the process for loading data into our project, and thus I only present here the main points and how we can overcome an error when a large dataset is retrieved (probably caused by the maximum number of cells per table we can select in the API).
We would need to install the package from CRAN, and load it into our project. I will also load tidyverse for working with the data.
  if (!require("danstat")) install.packages("danstat")
  if (!require("tidyverse")) install.packages("tidyverse")

  library(danstat)
  library(tidyverse)
First we would need to identify the table we would like to download. On the Statistics Denmark website we can see that there is a table identifier before its description (i.e. FOLK1C: Population at the first day of the quarter by region, sex, age (5 years age groups), ancestry and country of origin). This is what we need although we can also get this information using get_subjects and get_tables.
We can see all the info associated to the table with get_table_metadata but we are mainly interested on two pieces of information. One is the parameters of the table, which we would need for selecting the variables to download from the table (e.g. region, sex, age, …):
  table <- "FOLK1C"
  dat_meta <- get_table_metadata(table_id = table, variables_only = TRUE)
  dat_meta %>% select(id, text)
## id text
## 1 OMRÅDE region
## 2 KØN sex
## 3 ALDER age
## 4 HERKOMST ancestry
## 5 IELAND country of origin
## 6 Tid timeAnd the other is the possible values of these parameters (e.g. Sex: TOT = Total, 1 = Men, 2 = Women):
  # Show the first values of each parameter
  lapply(dat_meta$values, head, n = 5)
## [[1]]
## id text
## 1 000 All Denmark
## 2 084 Region Hovedstaden
## 3 101 Copenhagen
## 4 147 Frederiksberg
## 5 155 Dragør
##
## [[2]]
## id text
## 1 TOT Total
## 2 1 Men
## 3 2 Women
##
## [[3]]
## id text
## 1 IALT Total
## 2 0-4 0-4 years
## 3 5-9 5-9 years
## 4 10-14 10-14 years
## 5 15-19 15-19 years
##
## [[4]]
## id text
## 1 TOT Total
## 2 5 Persons of Danish origin
## 3 4 Immigrants
## 4 3 Descendant
##
## [[5]]
## id text
## 1 0000 Total
## 2 5100 Denmark
## 3 5122 Albania
## 4 5124 Andorra
## 5 5126 Belgium
##
## [[6]]
## id text
## 1 2008K1 2008Q1
## 2 2008K2 2008Q2
## 3 2008K3 2008Q3
## 4 2008K4 2008Q4
## 5 2009K1 2009Q1We will need this information when using get_data, both for table_id and variables arguments. In our case table_id = FOLK1C, while variables is a list with two values in each element (code and values). Code is the parameter (e.g. sex) we want from the table, and values are the specific values we will get (e.g. Total, Men, Women). If values = NA, we will retrieve all the information from that parameter. As an example, I will get the information of the population for All Denmark by sex (e.g. Men, Women), all age groups, and in the first quarter of 2020. Note that if we do not list a parameter in code, we will not get it.
  variables <- list(
    # All Denmark: region = 000
    list(code = "OMRÅDE", values = "000"),
    # Only Men and Women
    list(code = "KØN", values = c(1, 2)),
    # All ages groups
    list(code = "ALDER", values = NA),
    # First quarter of 2020
    list(code = "Tid", values = "2020K1")
    )

  dat <- get_data("FOLK1C", variables)
  dat
## # A tibble: 44 x 5
## OMRÅDE KØN ALDER TID INDHOLD
## <chr> <chr> <chr> <chr> <dbl>
## 1 All Denmark Men Total 2020Q1 2896918
## 2 All Denmark Men 0-4 years 2020Q1 158286
## 3 All Denmark Men 5-9 years 2020Q1 157127
## 4 All Denmark Men 10-14 years 2020Q1 173744
## 5 All Denmark Men 15-19 years 2020Q1 175643
## 6 All Denmark Men 20-24 years 2020Q1 194954
## 7 All Denmark Men 25-29 years 2020Q1 204408
## 8 All Denmark Men 30-34 years 2020Q1 182835
## 9 All Denmark Men 35-39 years 2020Q1 165977
## 10 All Denmark Men 40-44 years 2020Q1 182485
## # ... with 34 more rowsWe can now use the data. For example, I will plot the population pyramid using a predefined function I built in a personal package (it is really useful to create personal packages with functions we use regularly but it is another post. However, if you were interested on learning how to write R packages there is an excelled post from Hilary Parker).
  if (!require("remotes")) install.packages("remotes")
  if (!require("ggpyramid"))  remotes::install_github("javiereliomedina/ggpyramid")

  library(ggpyramid)
dat %>%
# Translate into English
rename(region = OMRÅDE,
gender = KØN,
age = ALDER,
date = TID,
pop = INDHOLD) %>%
# Remove age group = Total
filter(age != "Total") %>%
# Format age (consecutive levels)
mutate(age = ifelse(age == "100 years and over", "100OV", age),
age = gsub(" years", "", age),
age = factor(age, levels = subset(dat_meta$values[[3]], id != "IALT")$id)) %>%
ggpyramid() +
labs(title = "Population pyramith of Denmark",
subtitle = "Date: 2020-Q1",
caption = "Data source: Statistics Denmark\nAuthors: J. Elio (@Elio_Javi), C. Keßler, H.S. Hansen. Aalborg University, Department of Planning")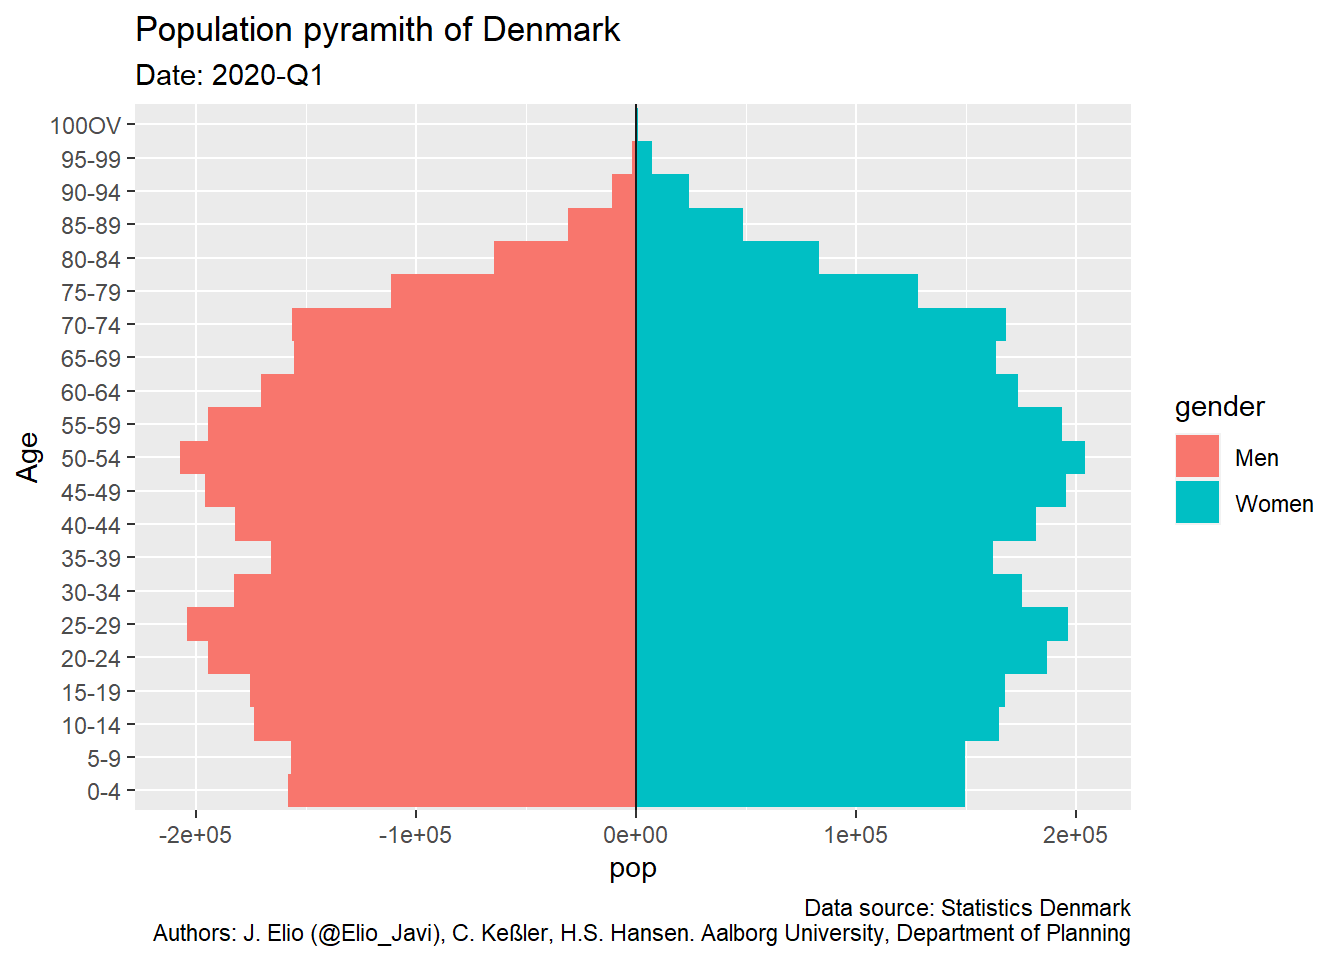
We have seen how to get the data. The different type of data we may have is great, and will help beginners to play with real data. However, if we tried to have large datasets (for example to analyse changes over time) we may get an error. In our example, if we fill all values with NA (i.e. get all the information from a variable) we will have the following error.
  variables <- list(
    # All Denmark: region = 000
    list(code = "OMRÅDE", values = NA),
    # Only Men and Women
    list(code = "KØN", values = NA),
    # All ages groups
    list(code = "ALDER", values = NA),
    # All years
    list(code = "Tid", values = NA)
    )

  get_data("FOLK1C", variables)
## Error: API did not return text/csvWe can overcome this error by getting smaller pieces of information (e.g. get the information only by one quarter) and then putting all together in a data frame. I create therefore an auxiliary function for making it, and then use furrr::future_map for speeding up the process since it may be run in parallel.
  library(furrr)

  # Auxiliary function
    steps <- function(quarter){
      var_values <- list(id_region, id_sex, id_age, quarter)
      var_input <- purrr::map2(.x = var_codes, .y = var_values, .f = ~list(code = .x, values = .y))
      get_data(id_table, variables = var_input)
    }

  # table
  id_table <- "FOLK1C"

  # Codes for var_input
  var_codes <- c("OMRÅDE", "KØN", "ALDER",  "Tid")

  # Values for var_input
  id_region <- NA
  id_sex <- NA
  id_age <- NA
  id_quarter <- dat_meta$values[[6]]$id   # Select all quarters

   # Parallel process with {future}
  plan(multiprocess)
  dat <- id_quarter %>% future_map(steps)
  dat <- bind_rows(dat)
  plan("default")

  dat
## # A tibble: 360,360 x 5
## OMRÅDE KØN ALDER TID INDHOLD
## <chr> <chr> <chr> <chr> <dbl>
## 1 All Denmark Total Total 2008Q1 5475791
## 2 All Denmark Total 0-4 years 2008Q1 325606
## 3 All Denmark Total 5-9 years 2008Q1 332439
## 4 All Denmark Total 10-14 years 2008Q1 351872
## 5 All Denmark Total 15-19 years 2008Q1 334263
## 6 All Denmark Total 20-24 years 2008Q1 303797
## 7 All Denmark Total 25-29 years 2008Q1 319723
## 8 All Denmark Total 30-34 years 2008Q1 367679
## 9 All Denmark Total 35-39 years 2008Q1 386883
## 10 All Denmark Total 40-44 years 2008Q1 428922
## # ... with 360,350 more rowsWe have seen how we can get data with danstat package. In next posts I will use them for data transformation and visualization. I will also link the data with spatial information for plotting informative maps in R, I hope you can also read them. Thank you for your time, any suggestion or comment is more than welcome!!!
Notes
I have created this post during my work as postdoctoral researcher at Aalborg University, in the project “Global flows of migrants and their impact on north European welfare states - FLOW”.
It is not endorsed by the university or the project, and it is not maintained. All the data I use here are public, and my only aim is that the post serves for learning R. For more information about migration and the project outcomes please visit the project’s website: https://www.flow.aau.dk.
Javier Elío
Associate Professor
My research interests include environmental sciences and data analysis.